Dashboard
Your real-time command center for monitoring honeypot activity across all servers.
Dashboard Overview
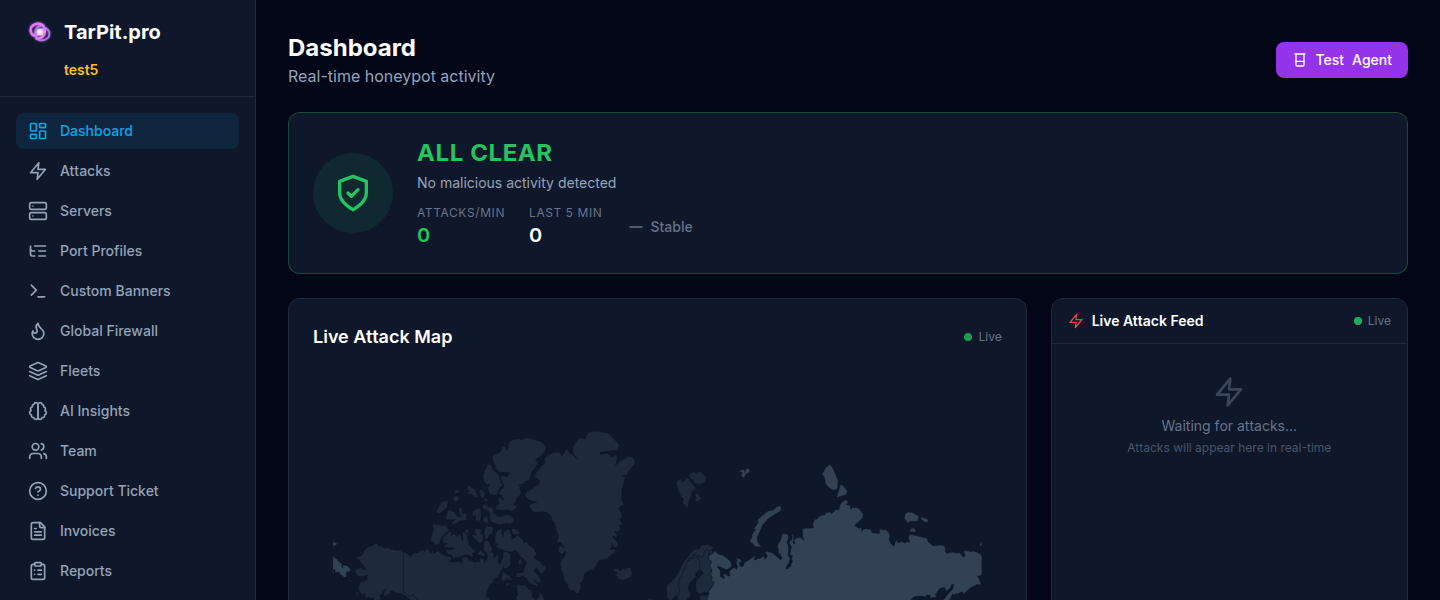
The dashboard is the first screen you see after logging in. It provides a real-time view of all attack activity across your connected servers, including a threat level indicator, live attack map, real-time feed, and summary statistics.

The main dashboard showing threat level, attack map, live feed, and statistics.
Threat Level Indicator
The threat level indicator at the top of the dashboard shows the current overall threat level based on recent attack volume and severity:
Live Attack Map
The interactive world map shows attacker locations in real-time. Each dot represents an incoming attack, colored by severity. Click any dot to see the attacker's IP, country, port targeted, and attack type.
Live attack map showing attacker locations with real-time updates.
Live Attack Feed
The live feed shows attacks as they happen in real-time. Each entry shows the attacker IP, target port, attack type, and timestamp. New entries animate in from the top.
The feed updates via WebSocket, no need to refresh the page. On the free tier, the feed shows the most recent attacks within the 24-hour retention window.
Statistics Cards
The statistics panel shows key metrics at a glance:
Total Attacks
Number of attacks captured in the current period
Time Wasted
Total time attackers spent stuck in the tarpit
Unique IPs
Distinct attacker IP addresses seen
Top Ports
Most targeted honeypot ports
Attack Timeline Heatmap
The heatmap shows attack volume over time, broken down by hour of day and day of week. This helps you identify patterns, for example, bot networks that scan during off-hours or targeted attacks during business hours.